Atlantic Niño
Monitoring and understanding tropical Atlantic climate variability
The Atlantic Niño is the dominant mode of interannual climate variability in the equatorial Atlantic Ocean. Although generally weaker than its Pacific counterpart (El Niño), it exerts a profound influence on regional climate, marine ecosystems, fisheries, and rainfall over West Africa and northeastern South America. This page provides an overview of the phenomenon, the physical processes that govern its evolution, monitoring products, datasets, forecasts, and links to current research.
Monitoring the current state
This section will be updated automatically using GitHub Actions.
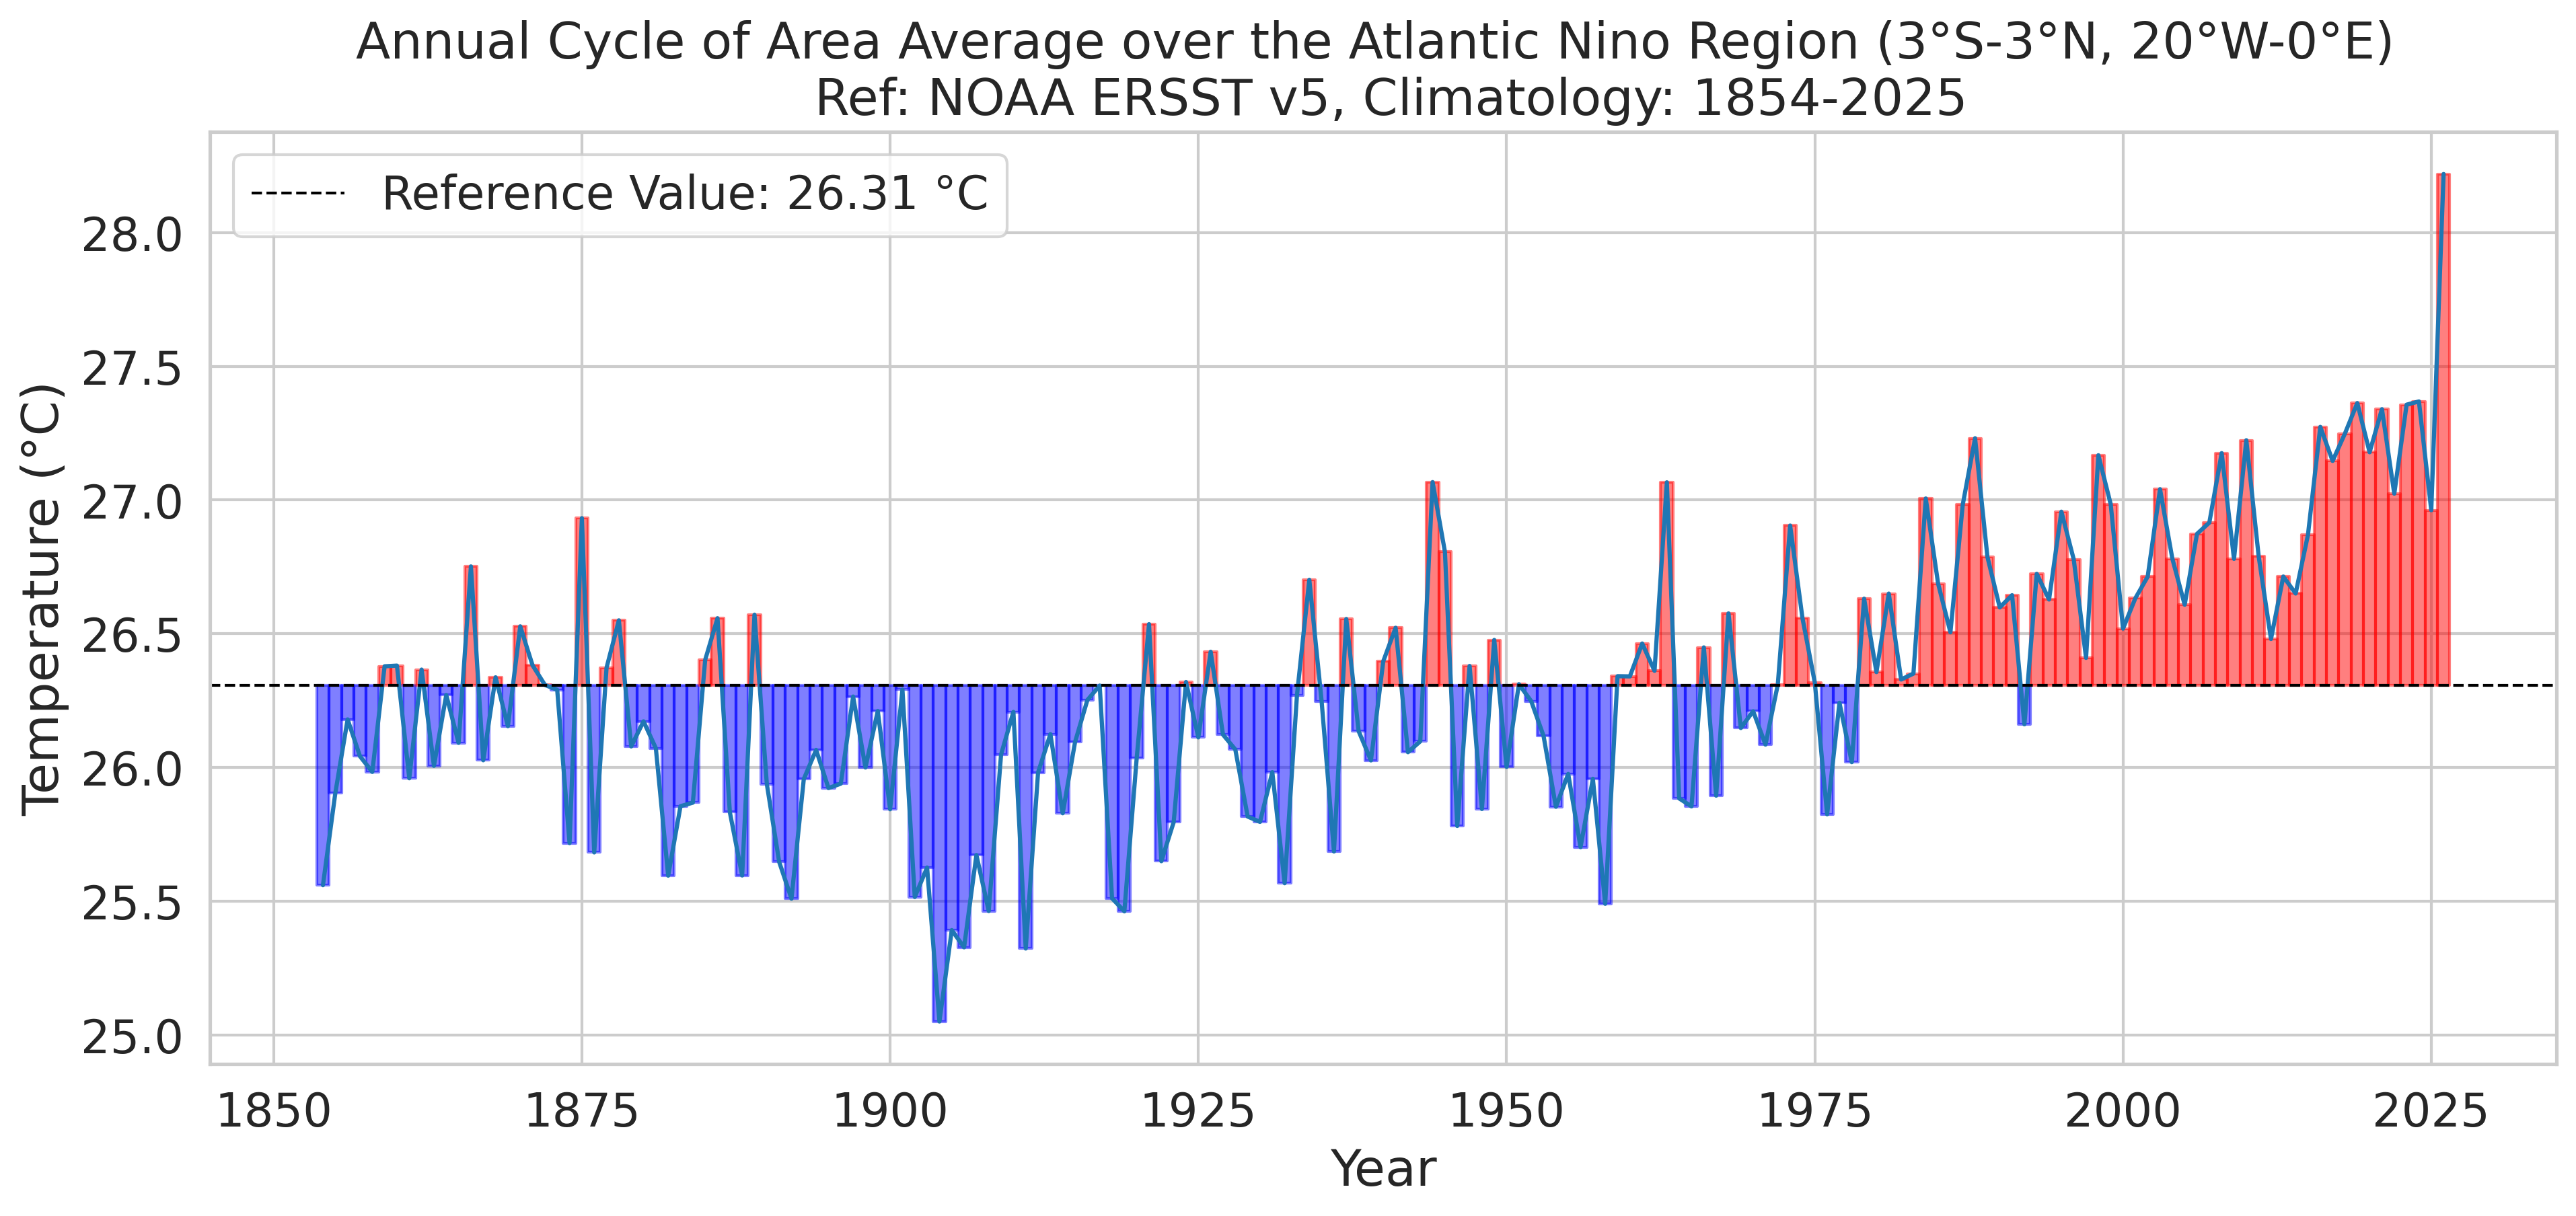
Current Atlantic Niño Index
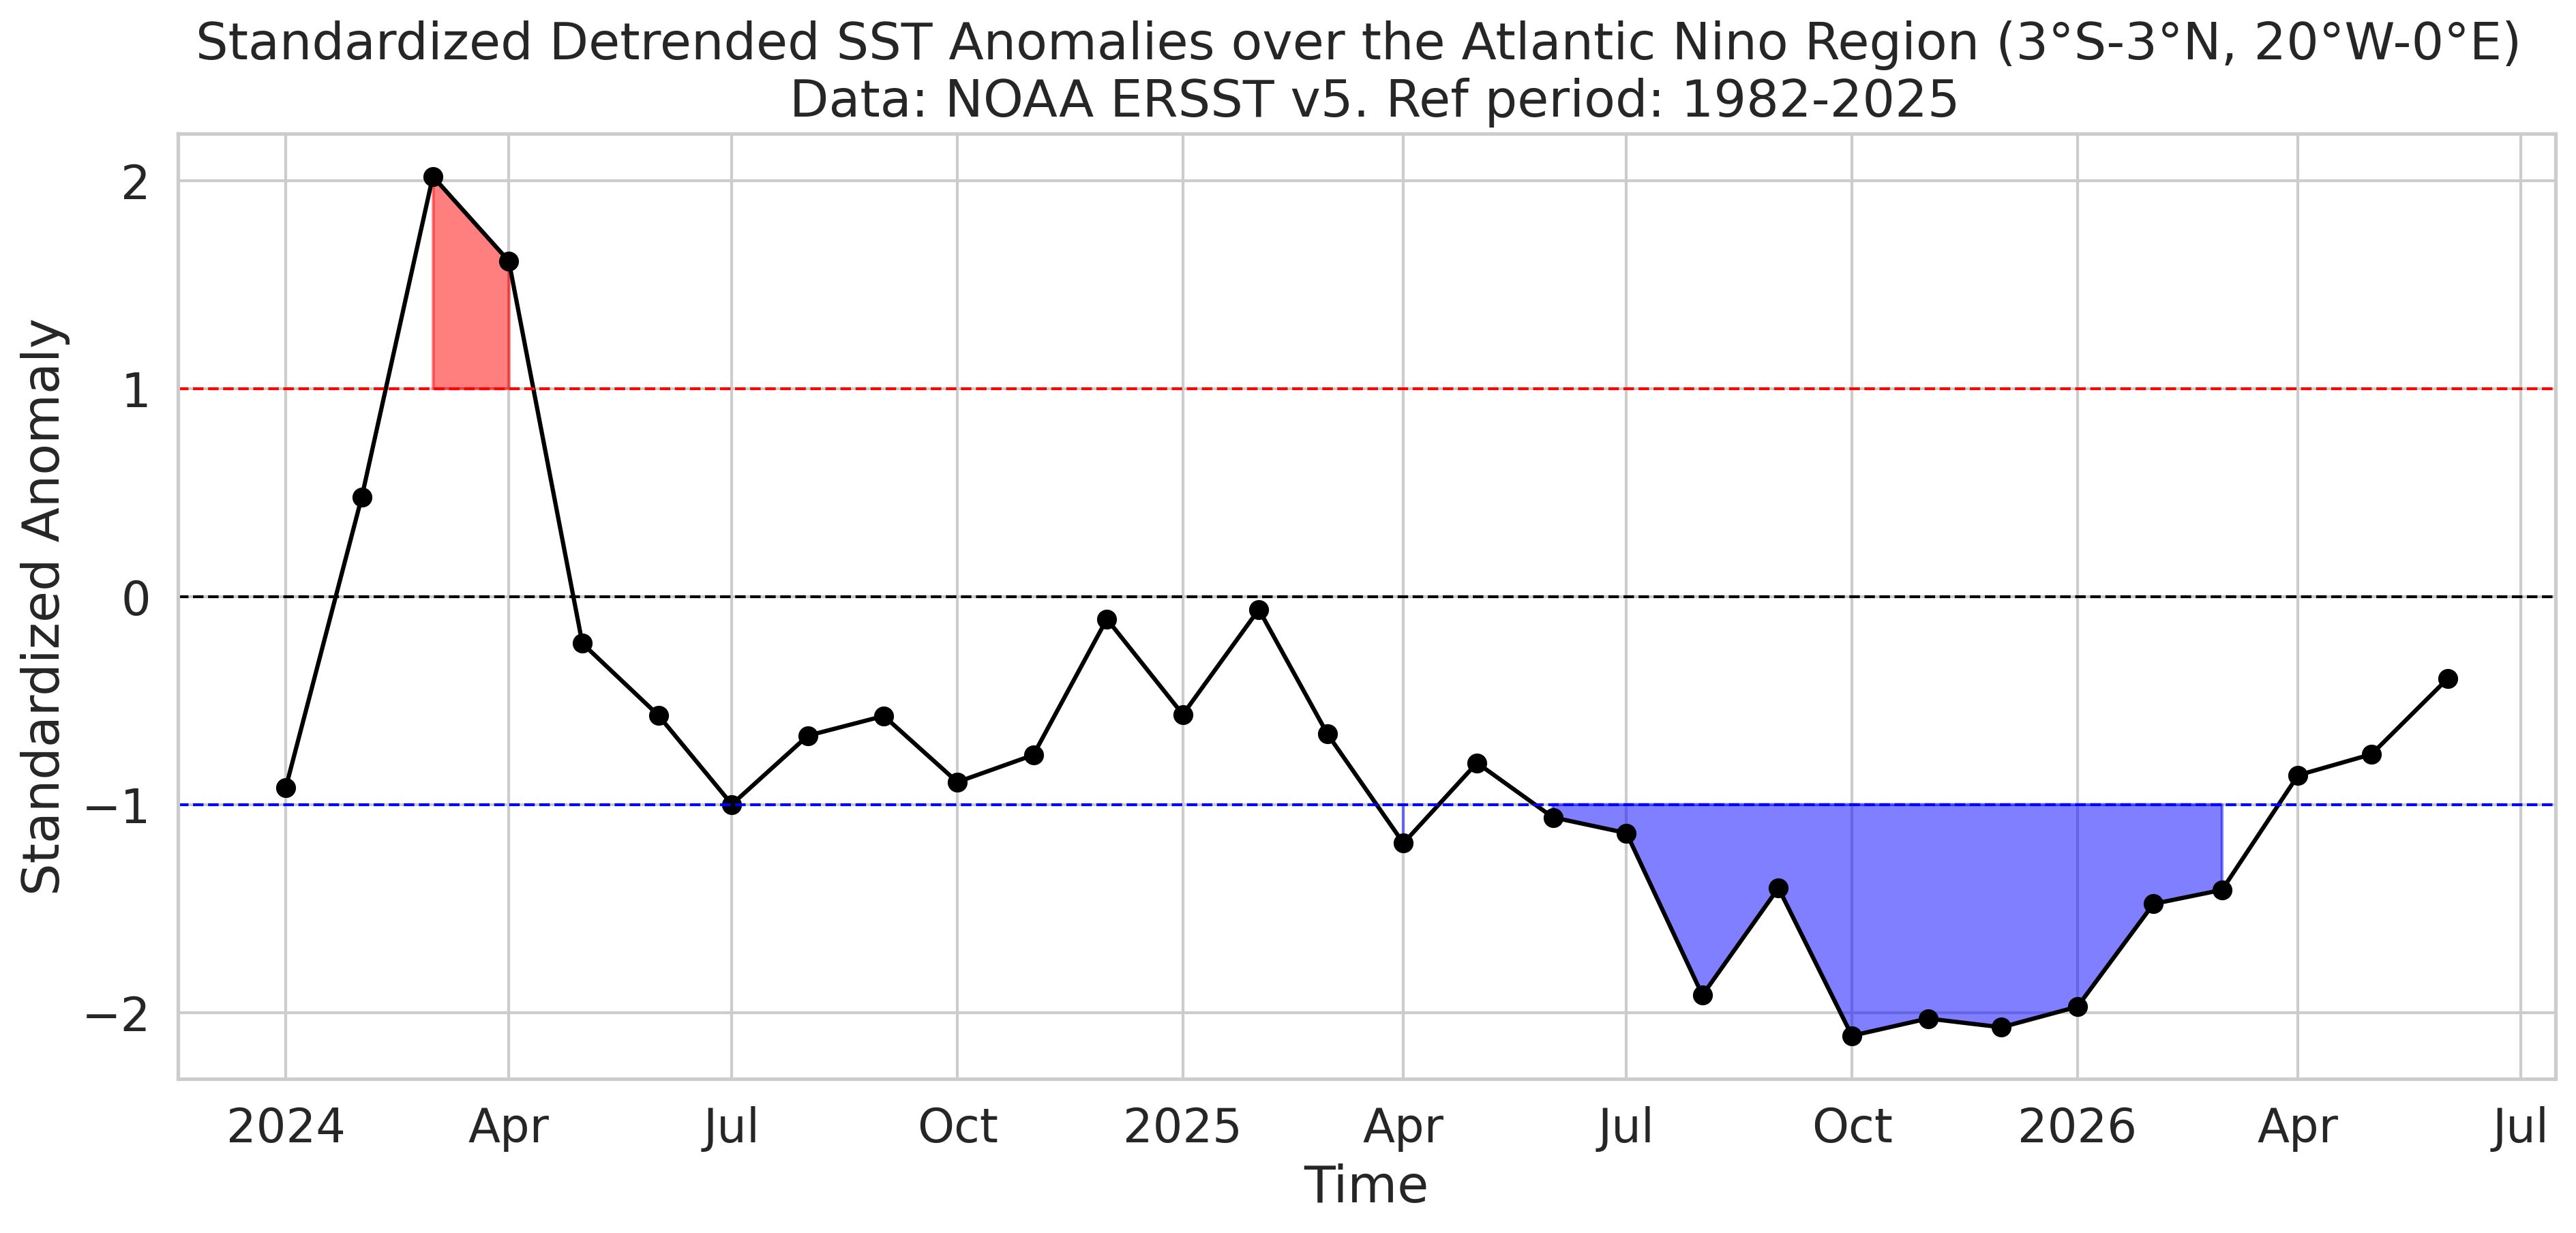
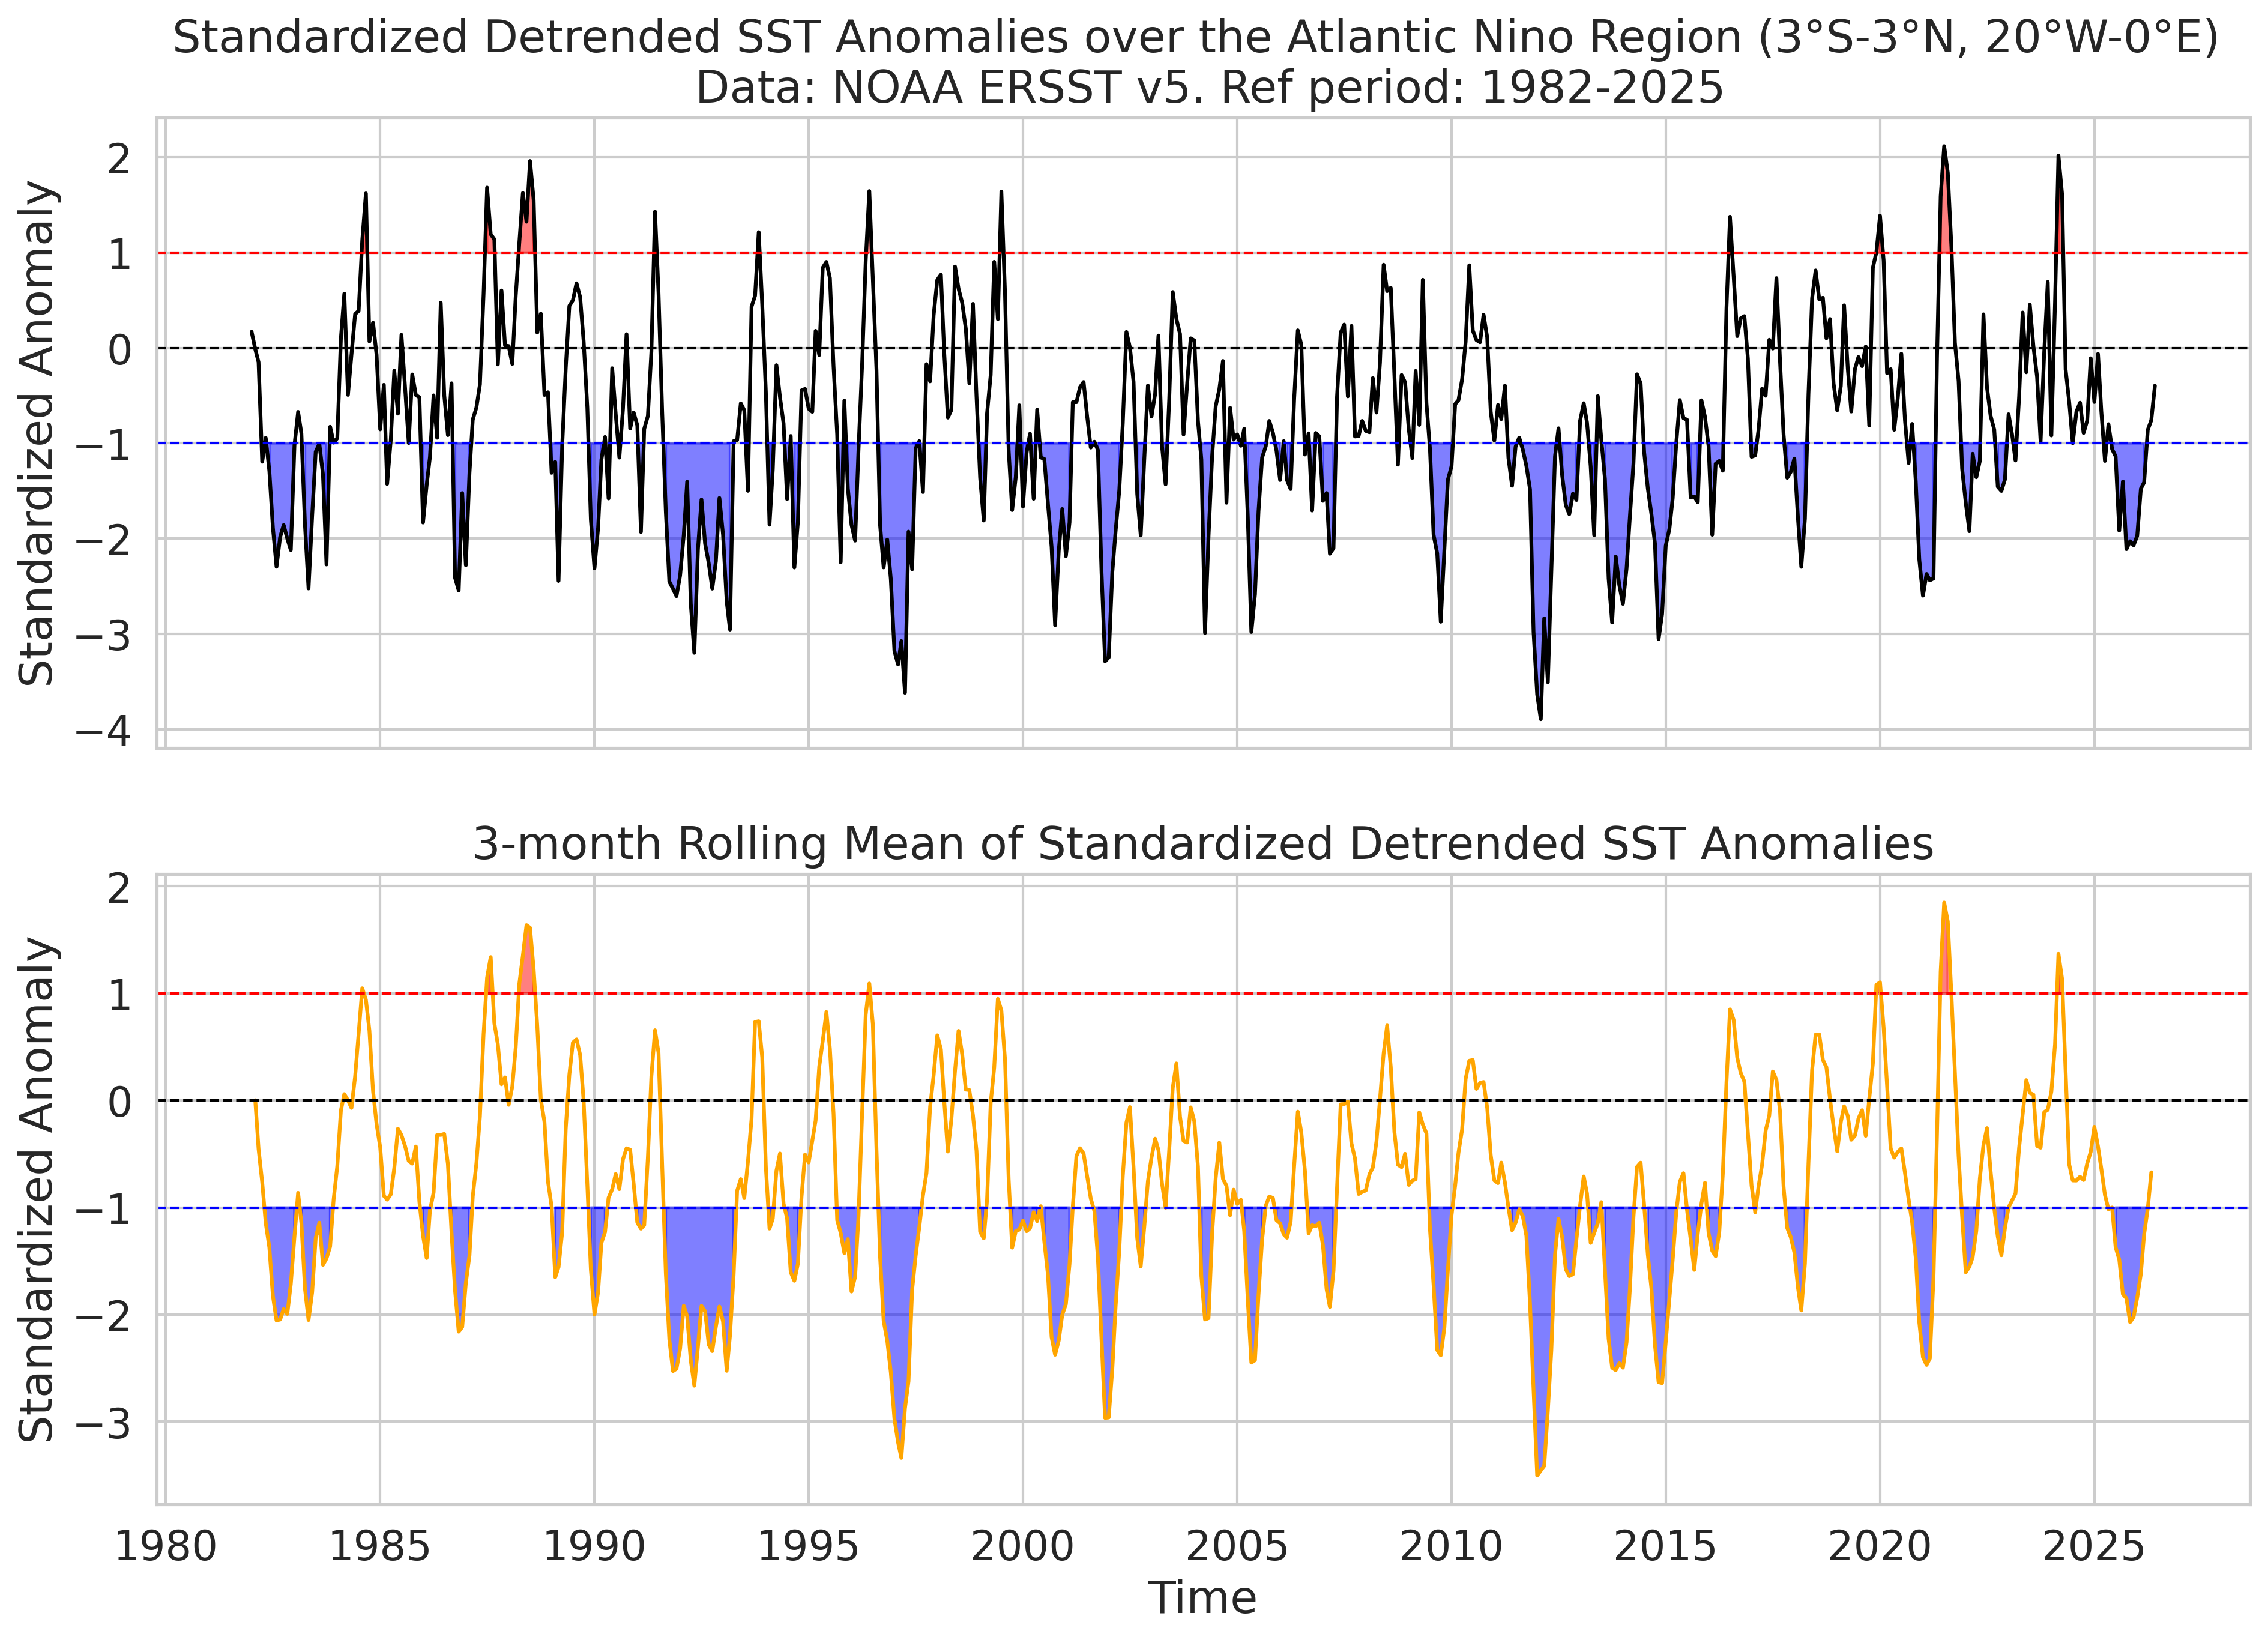
Equatorial Atlantic Sea surface temperature evolution
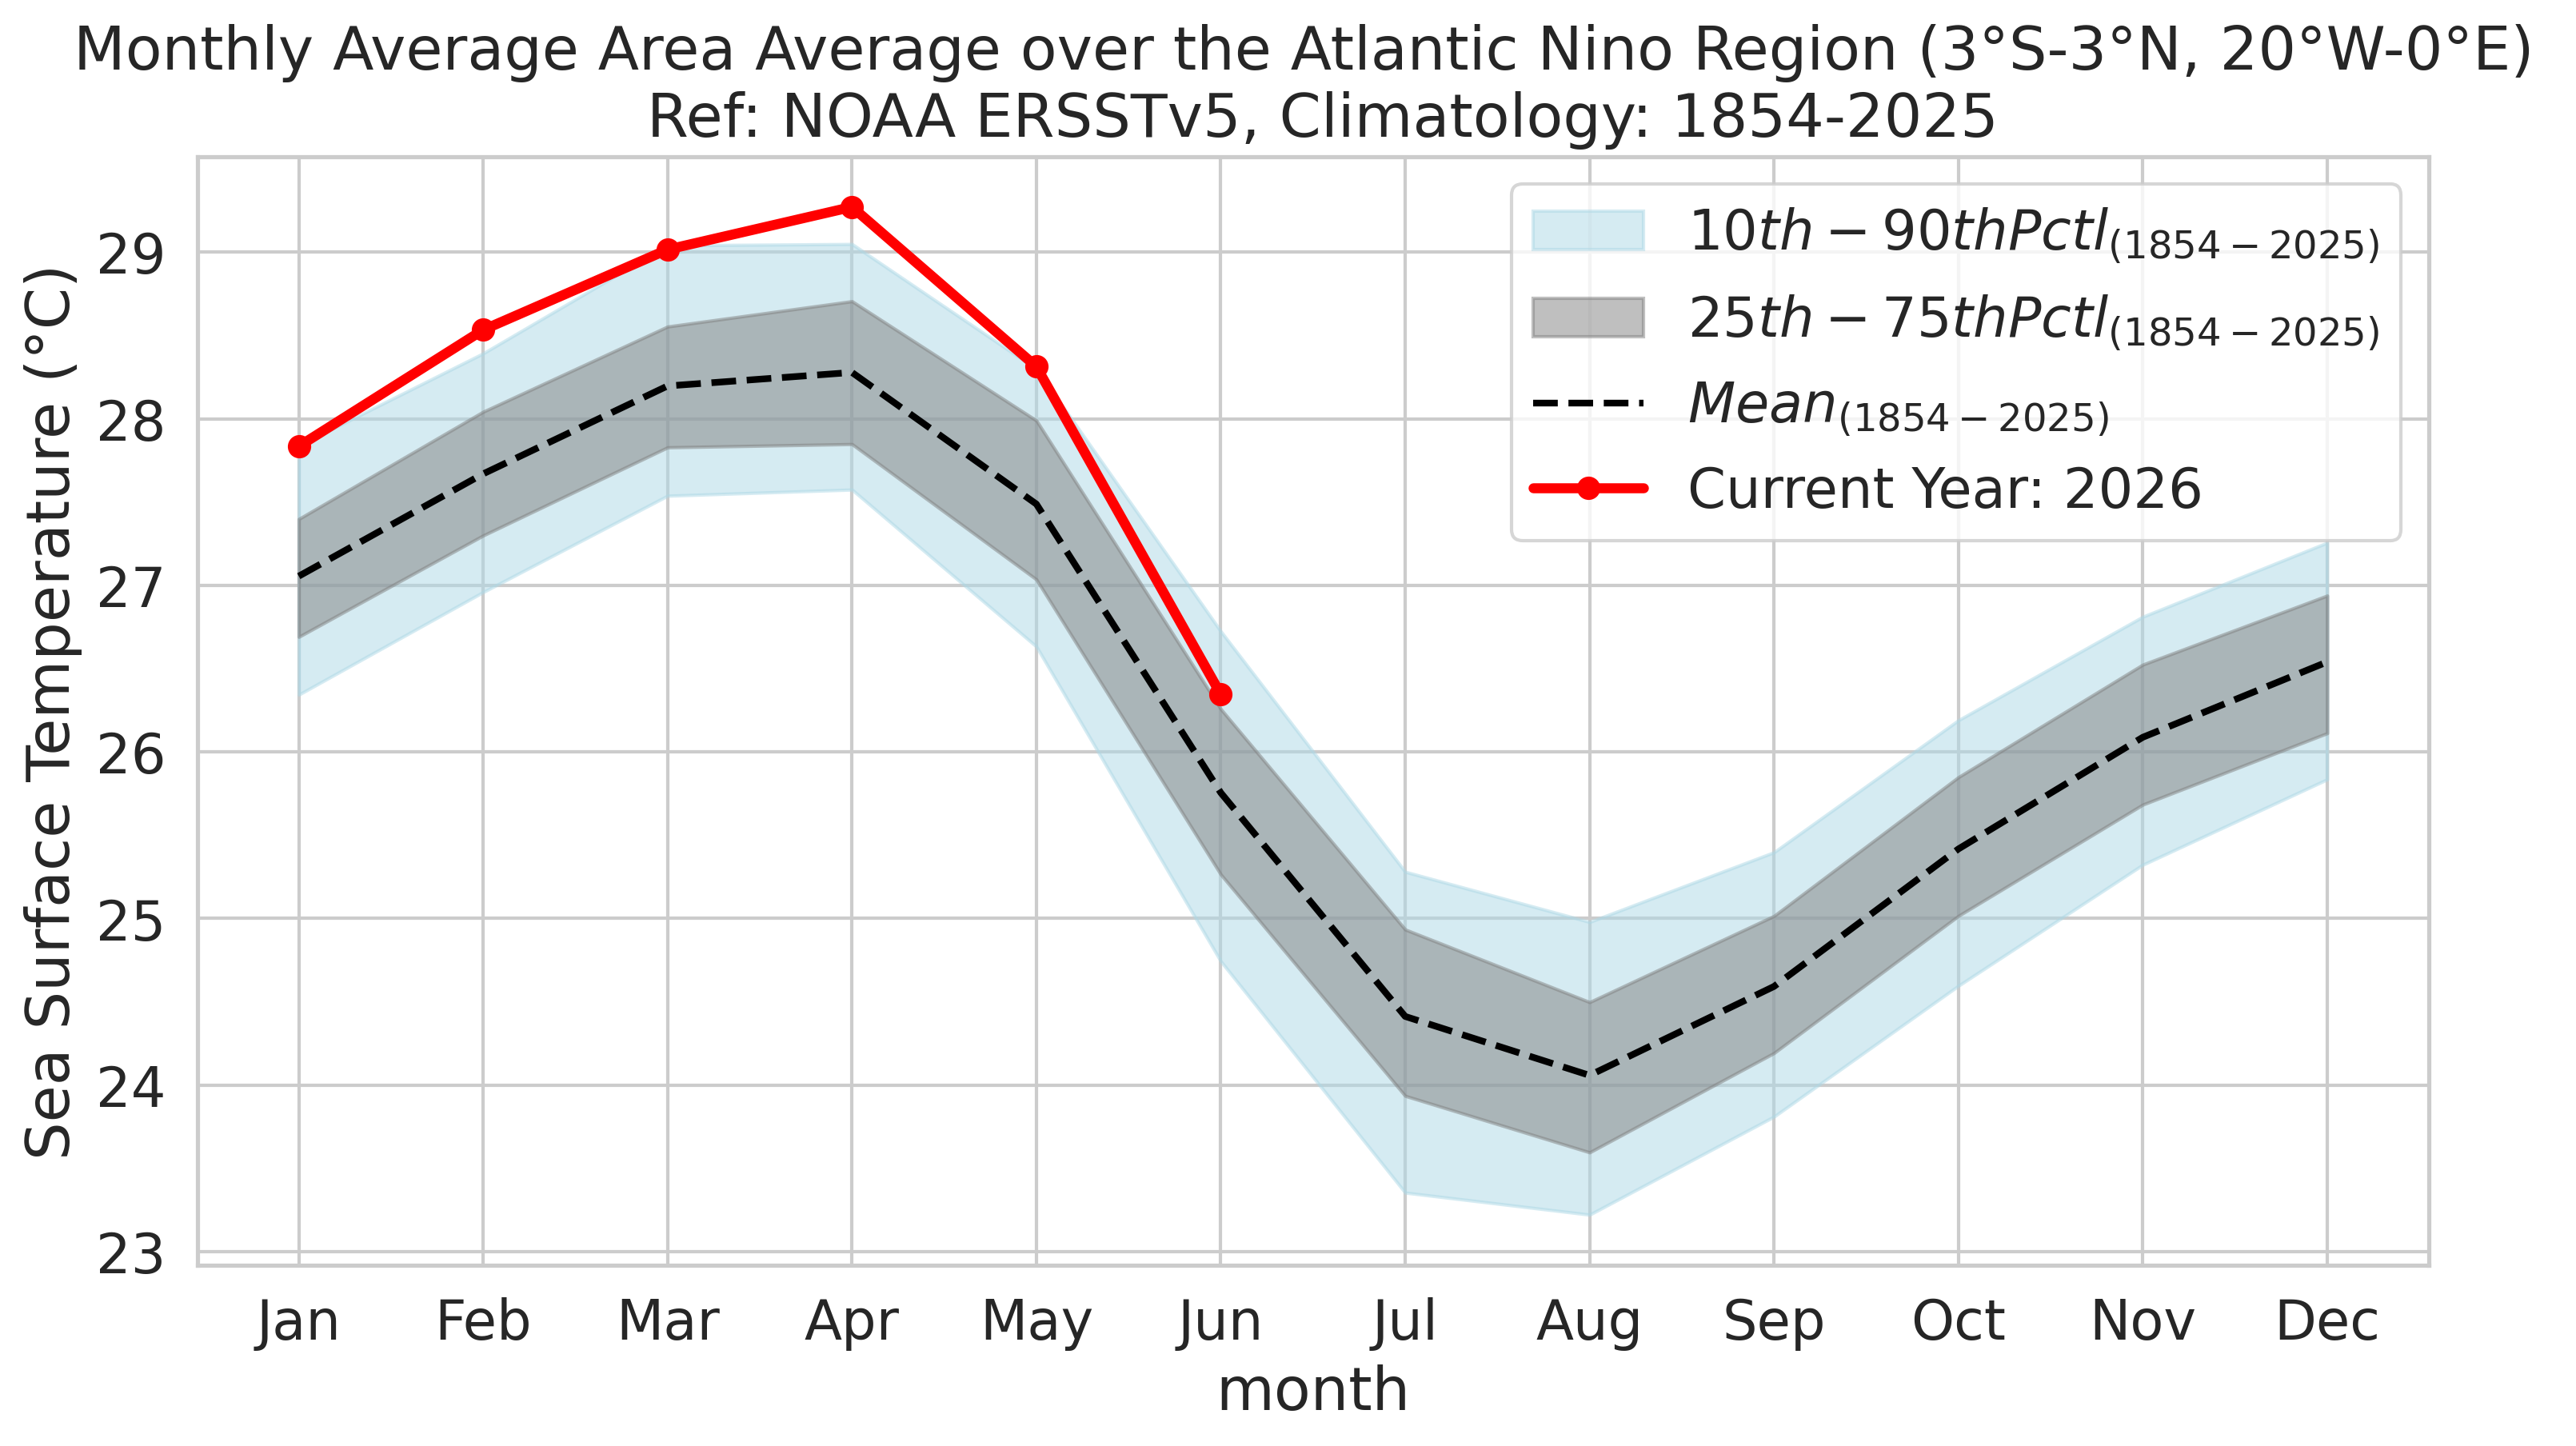
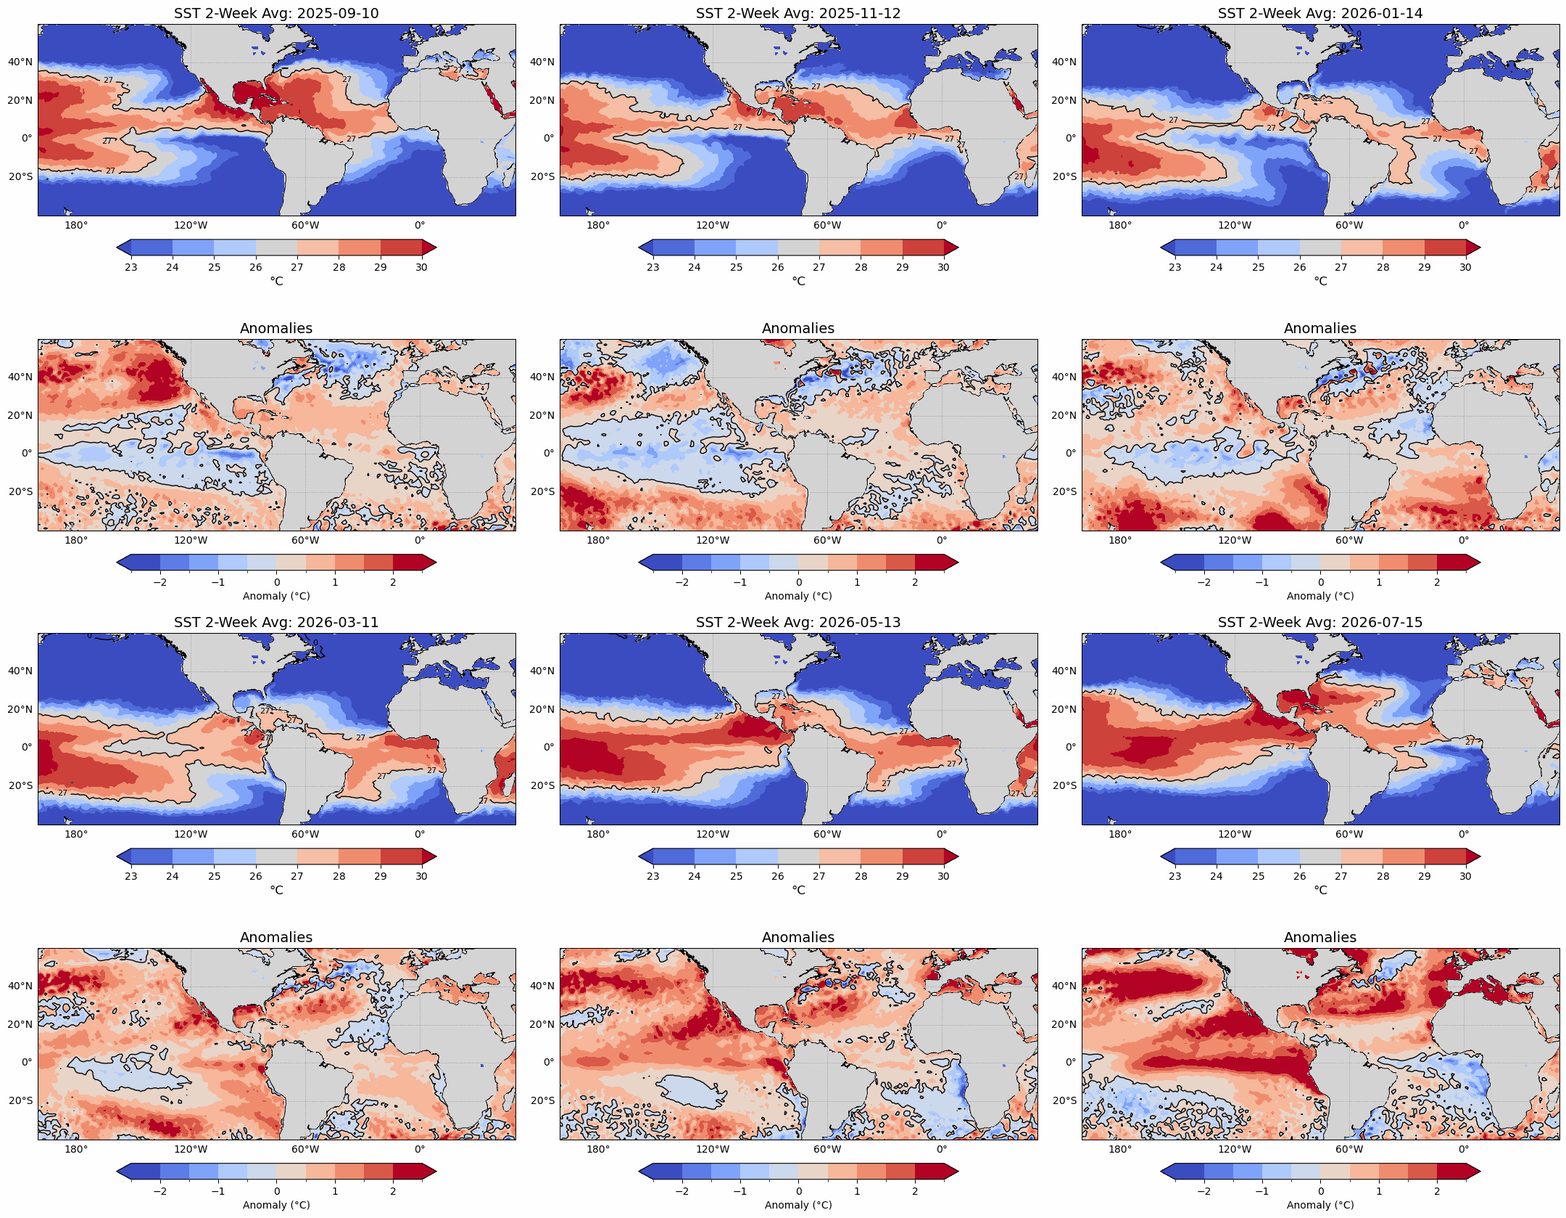
Two weeks averages of sea surface temperatures and their anomalies
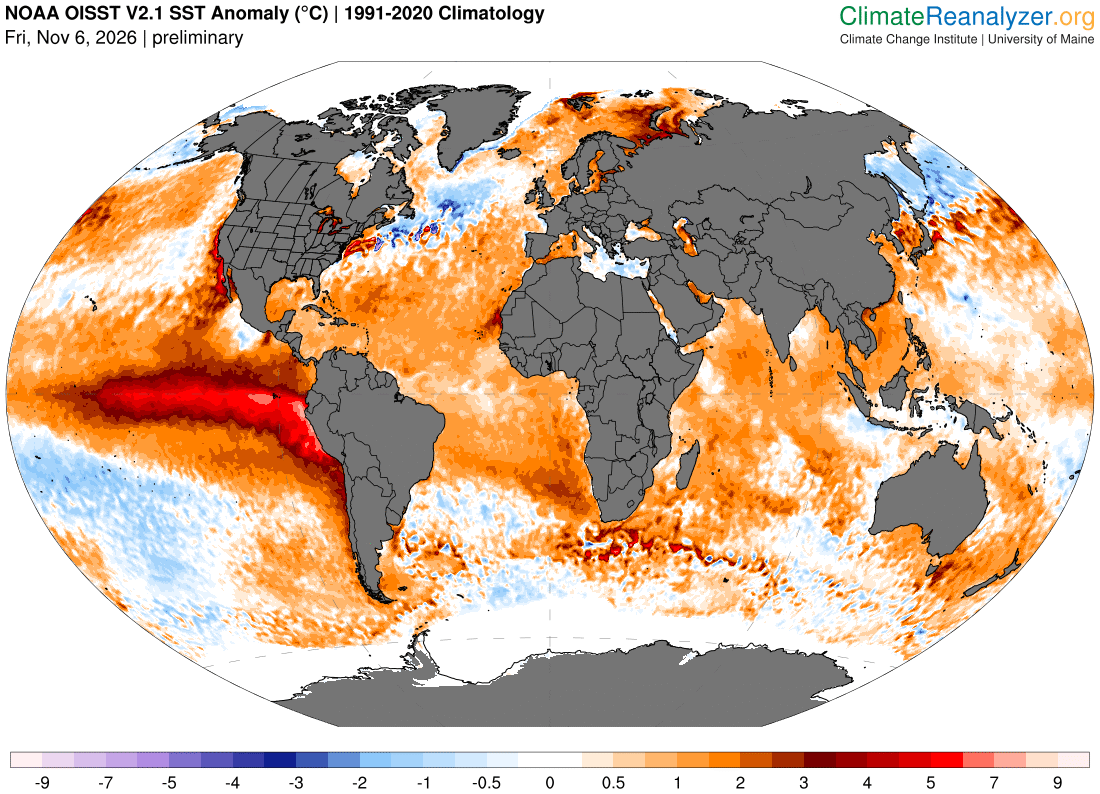
Recent daily sea surface temperature anomalies
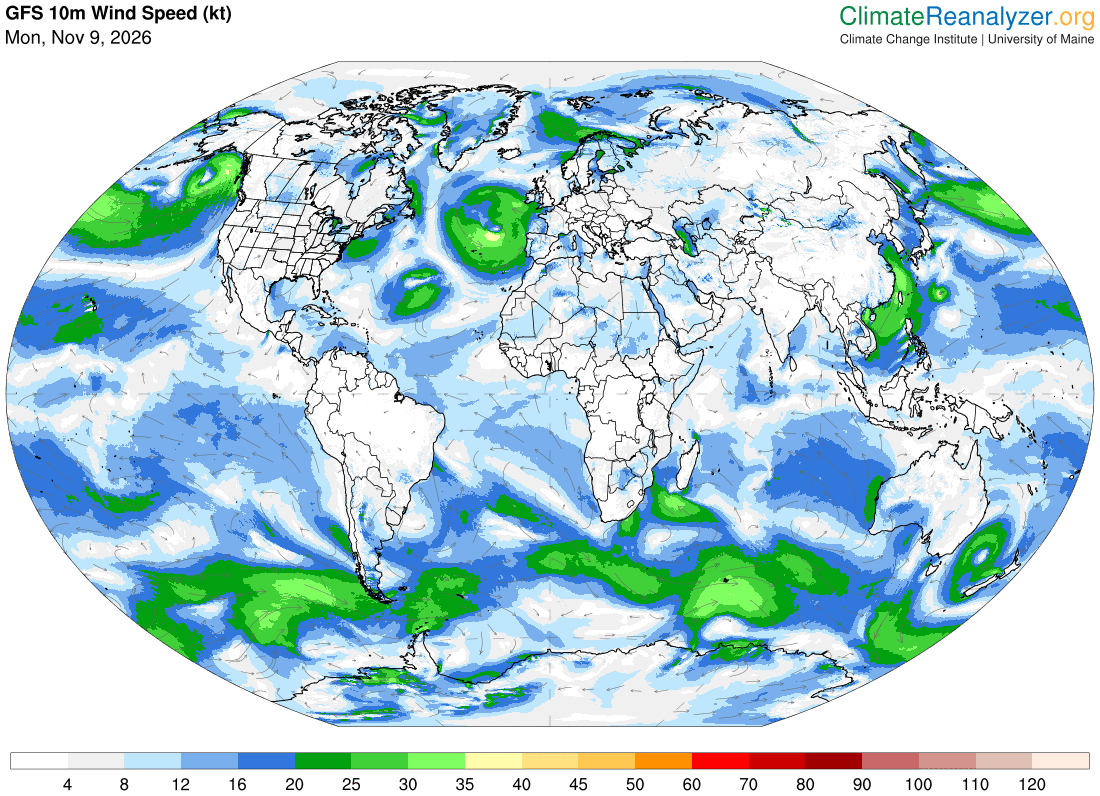
Surface winds
Sea surface temperature anomalies animation
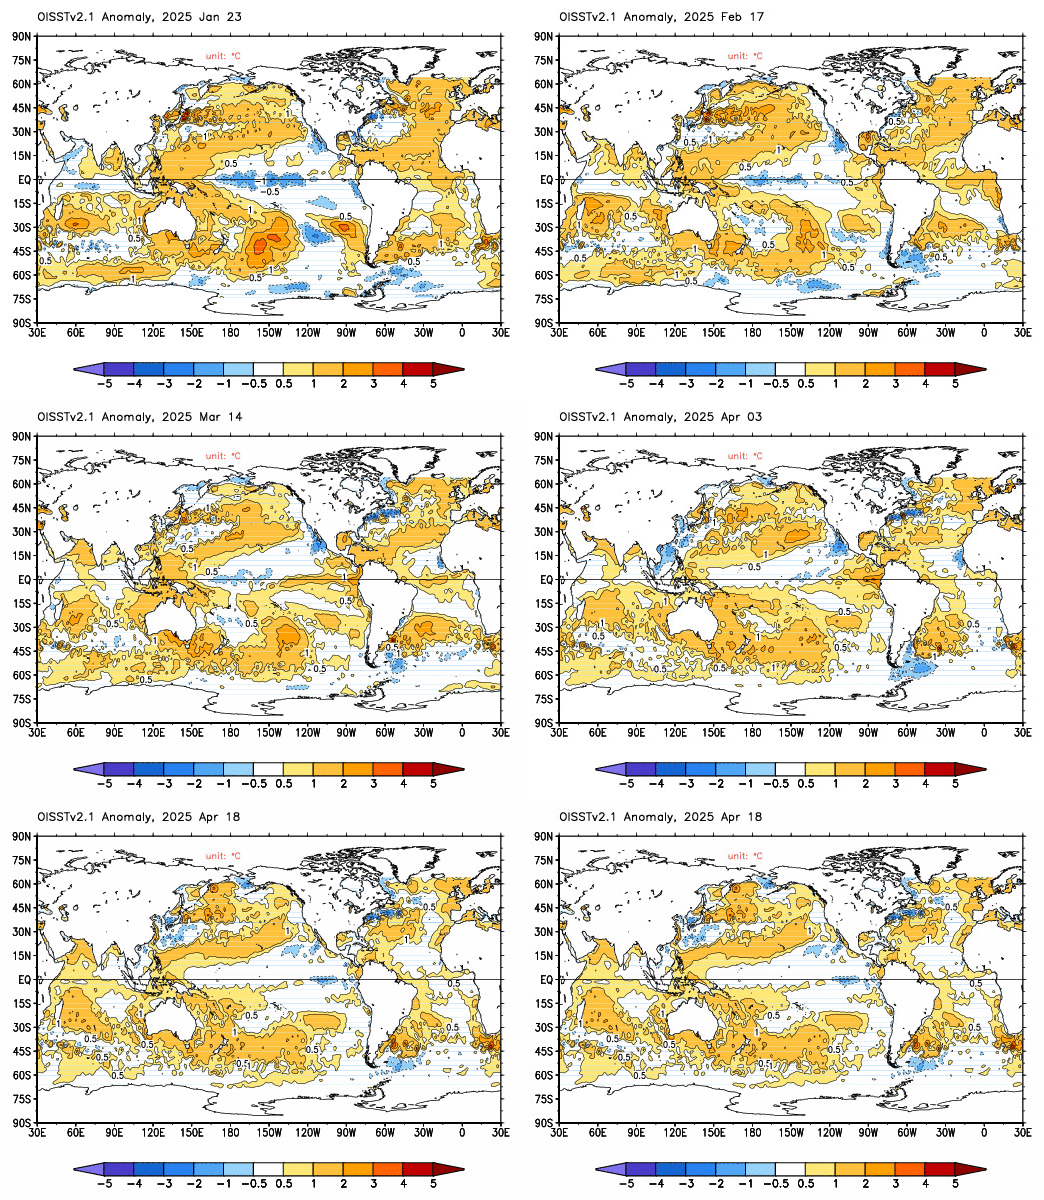
Figure. Global sea surface temperature anomalies (°C) relative to the 1991–2020 climatology. Source: NOAA CPC, Climate Prediction Center (2026).
Sea surface height anomalies animation

Thermocline depth and subsurface conditions, animations
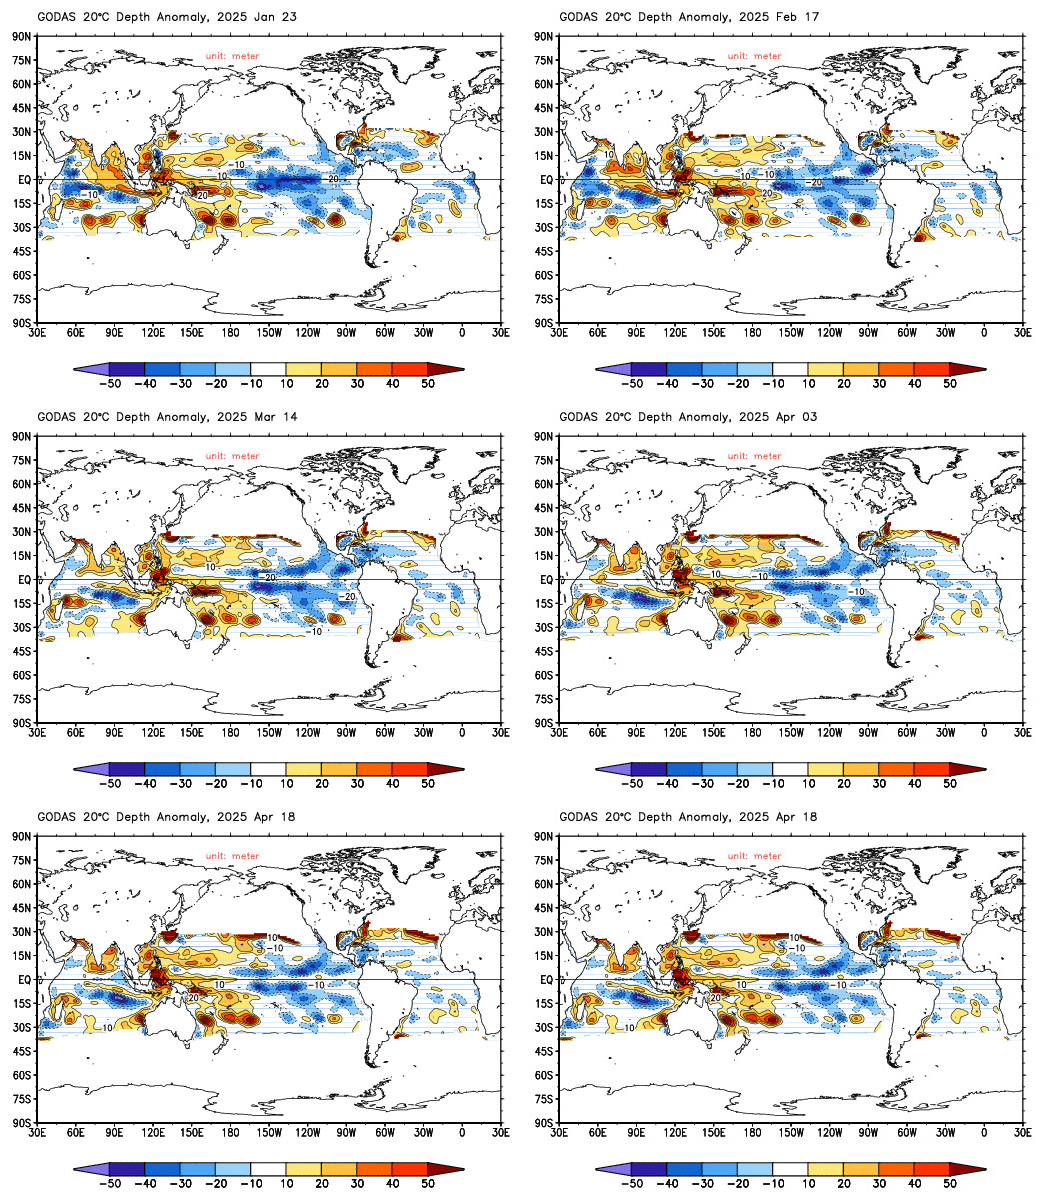
Figure. Thermocline depth anomalies, indicated by the 20°C isotherm depth. Source: NOAA CPC, Climate Prediction Center (2026).

Figure. Subsurface temperature anomalies (°C) relative to the 1991–2020 climatology. Source: NOAA CPC, Climate Prediction Center (2026). Cross-section of the tropical basin, along the equator, showing the evolution of subsurface temperature anomalies over time. The vertical axis represents depth (in meters), while the horizontal axis represents longitude (in degrees). Positive anomalies indicate warmer-than-average conditions, while negative anomalies indicate cooler-than-average conditions.
Convective activity and precipitation
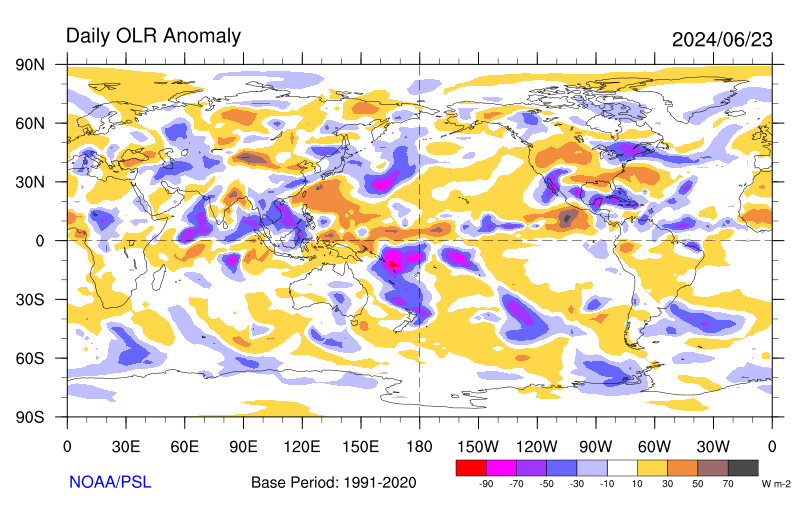
Figure. Outgoing longwave radiation (OLR) anomalies. Negative values indicate enhanced convection and precipitation, while positive values indicate suppressed convection and precipitation. Source: NOAA PSL, NOAA Physical Sciences Laboratory (2026).
Animations focused on the Atlantic Ocean are available from NOAA CPC, Climate Prediction Center (2026).
–> An example for the 31-day SST average