ENSO Key Diagnostic Figures
The figures from this page are retrieved from the NOAA Climate Prediction Center (CPC) ENSO monitoring products. They provide a visual summary of the current state of the El Niño–Southern Oscillation (ENSO) and its evolution over time.
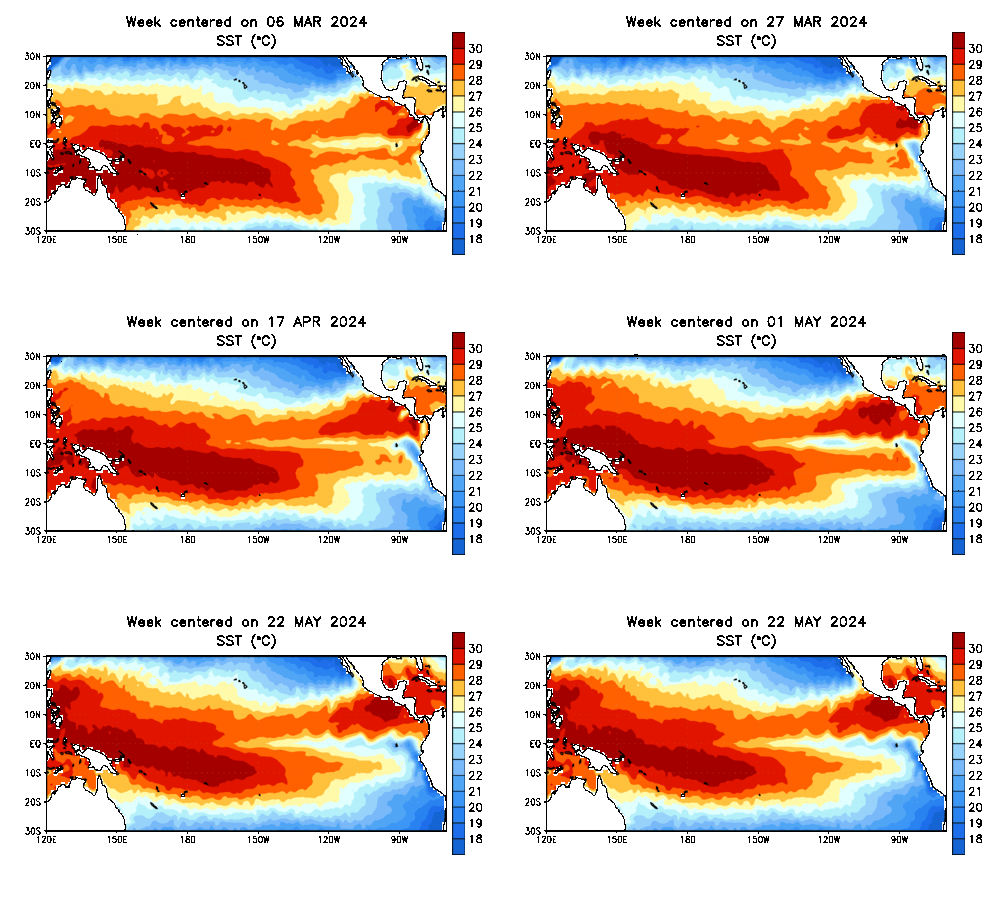
Figure. Weekly evolution of sea surface temperature in the tropical Pacific Ocean. Source: NOAA CPC.
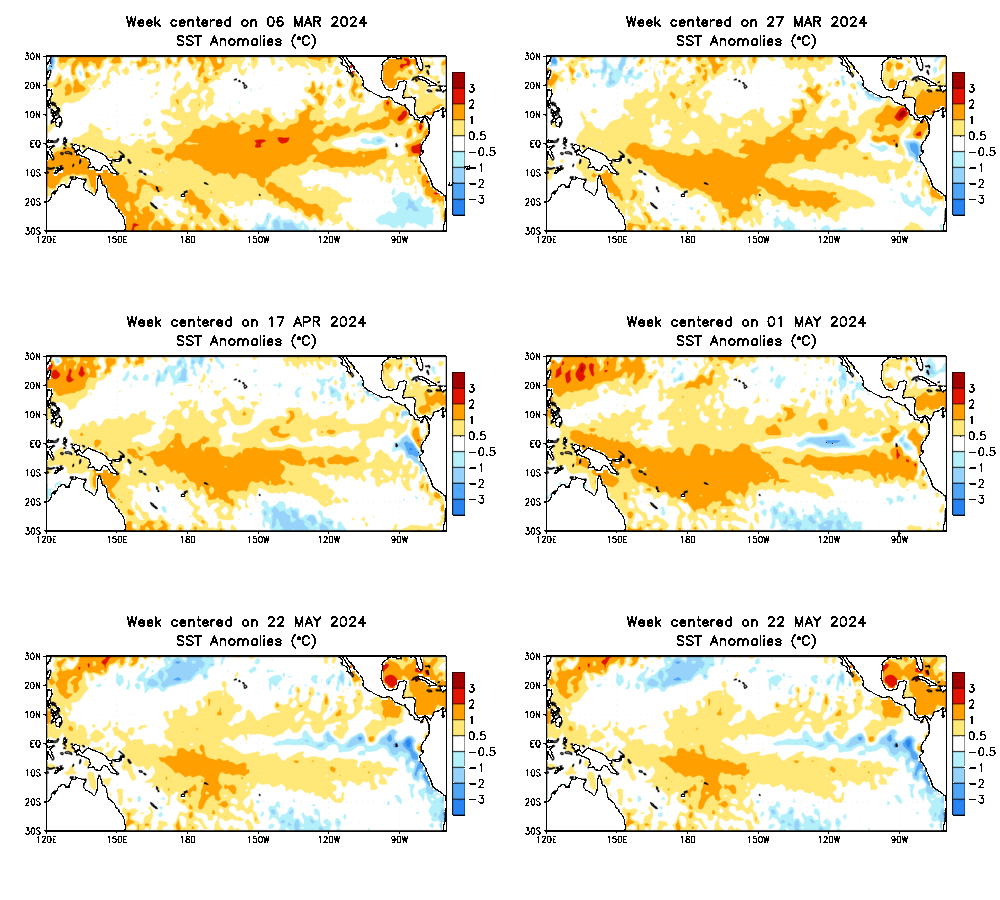
Figure. Sea surface temperature anomaly (°C) relative to the 1991–2020 climatology. Source: NOAA CPC.

Figure. Equatorial temperature (°C) variation with depth in the tropical Pacific Ocean. Source: NOAA CPC.

Figure. Equatorial temperature anomaly (°C) variation with depth in the tropical Pacific Ocean. Source: NOAA CPC.

Figure. Outgoing longwave radiation (OLR) anomalies. Source: NOAA CPC.

Figure. 850 hPa wind anomalies. Source: NOAA CPC.

Figure. 200 hPa wind anomalies. Source: NOAA CPC.
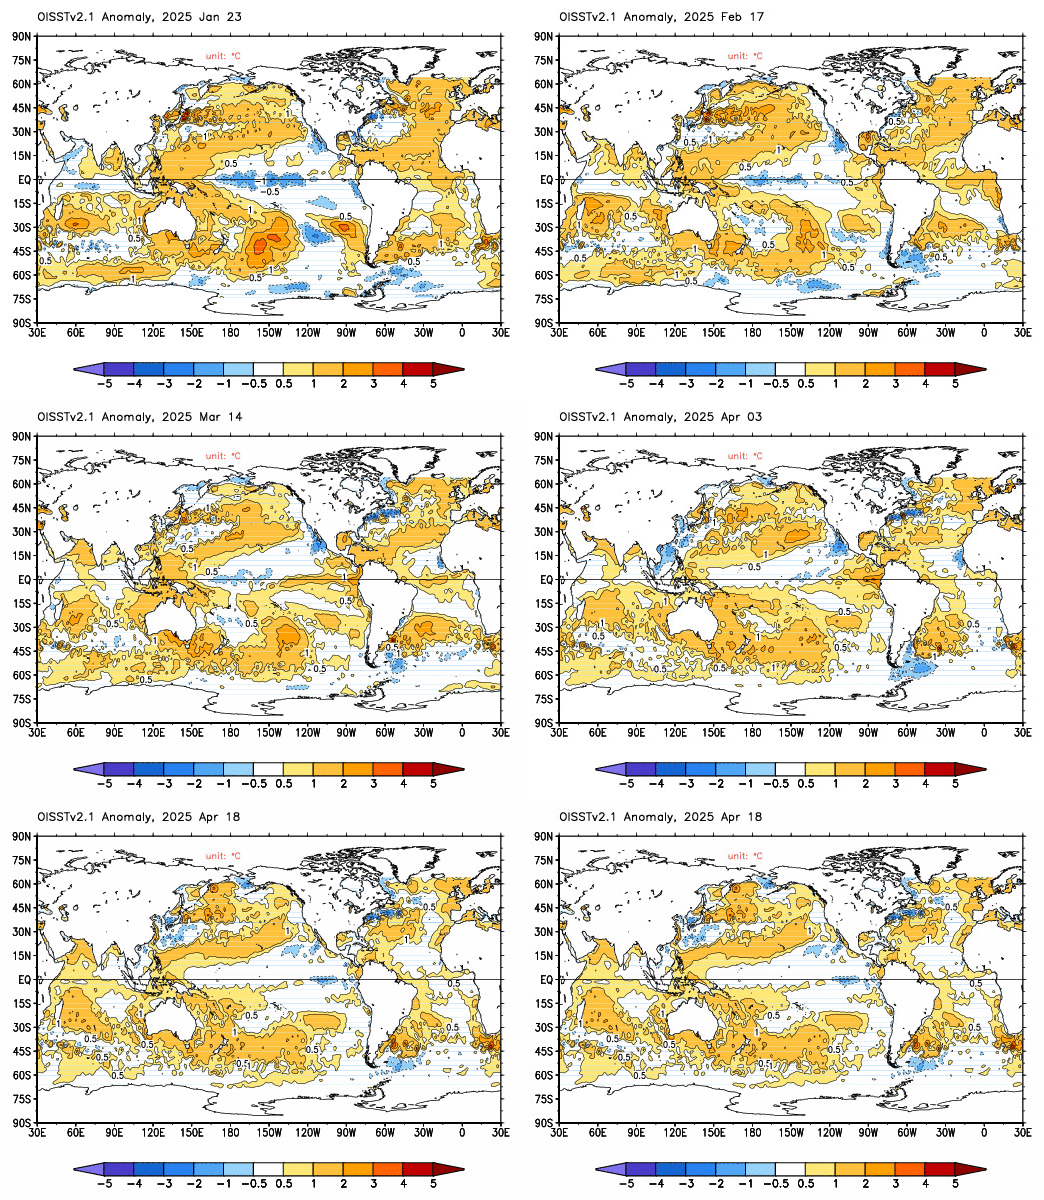
Figure. Global sea surface temperature anomalies (°C) relative to the 1991–2020 climatology. Source: NOAA CPC.
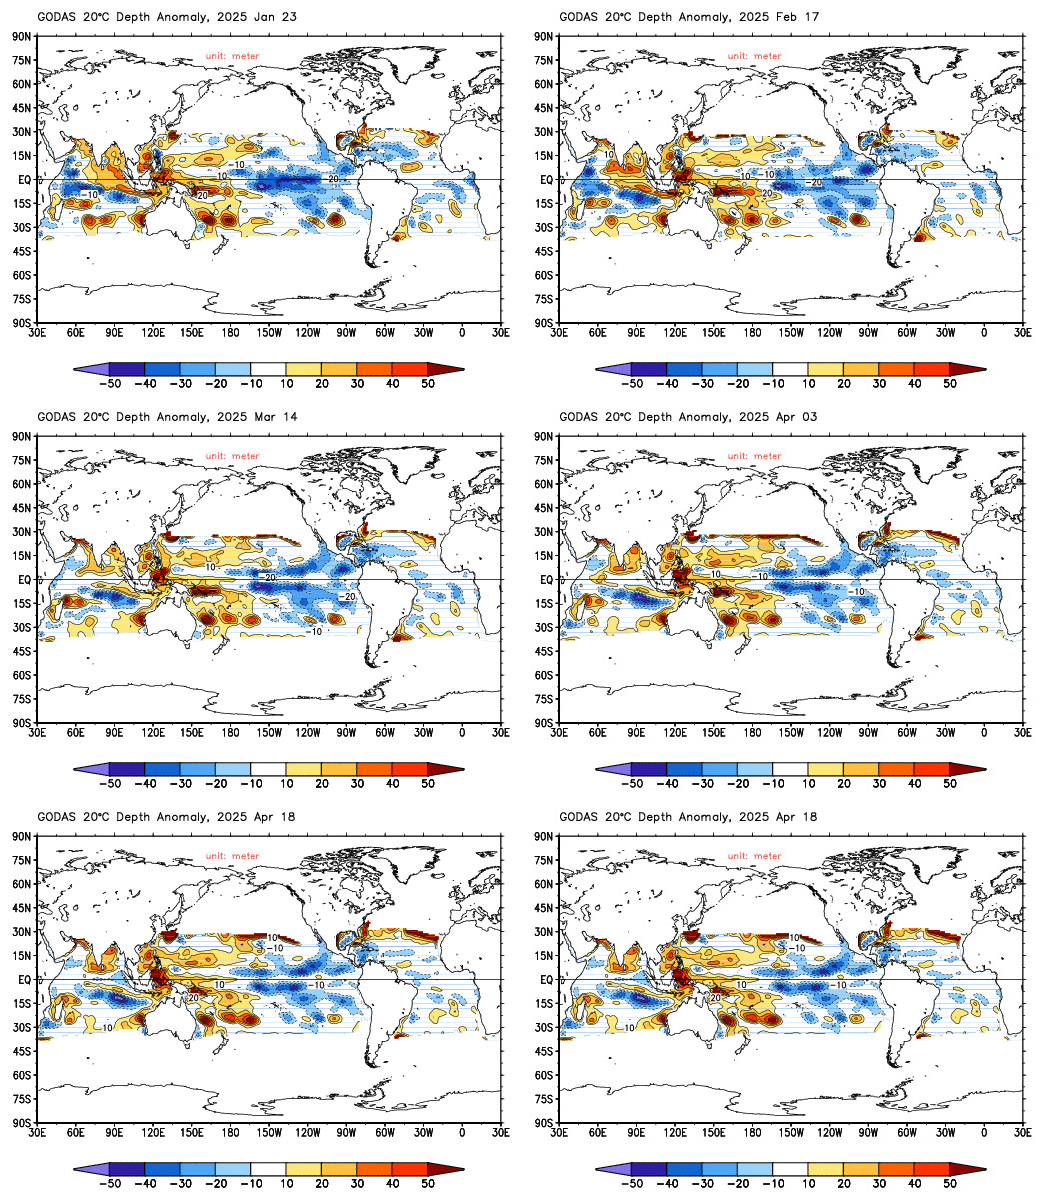
Figure. Thermocline depth anomalies, indicated by the 20°C isotherm depth. Source: NOAA CPC.

Figure. Sea surface height (SSH) anomalies. Source: NOAA CPC.

Figure. Subsurface temperature anomalies (°C) relative to the 1991–2020 climatology. Source: NOAA CPC. Cross-section of the tropical basin, along the equator, showing the evolution of subsurface temperature anomalies over time. The vertical axis represents depth (in meters), while the horizontal axis represents longitude (in degrees). Positive anomalies indicate warmer-than-average conditions, while negative anomalies indicate cooler-than-average conditions.